Mastering Fibonacci Trading in Forex: Your Definitive Guide
Discover how to use Fibonacci retracements and extensions in forex trading for strategic entries and exits.

Mastering Fibonacci Trading in Forex: Your Definitive Guide
Have you ever wondered why certain price levels in forex seem to act as magnets for price action? The answer often lies in the Fibonacci sequence. This age-old mathematical concept has found its place in the heart of forex trading, offering a strategic edge for traders who know how to use it effectively.
TL;DR - Key Takeaways
- Fibonacci levels are crucial for identifying potential reversal and continuation points in forex markets.
- Master the art of using retracements for entry points and extensions for setting targets.
- Combine Fibonacci with other technical indicators for robust trading strategies.
- Practice on demo accounts before applying Fibonacci strategies in live trading.
- Understand the risks and implement sound risk management practices.
Introduction to Fibonacci in Forex Trading
Fibonacci trading is not just about numbers; it's about understanding market psychology. The sequence and its derived ratios help traders pinpoint potential reversal zones, continuation patterns, and price targets. In a market as dynamic as forex, where the EUR/USD is trading around 1.0420 and USD/JPY at 157.50, knowing these levels can be a game-changer.
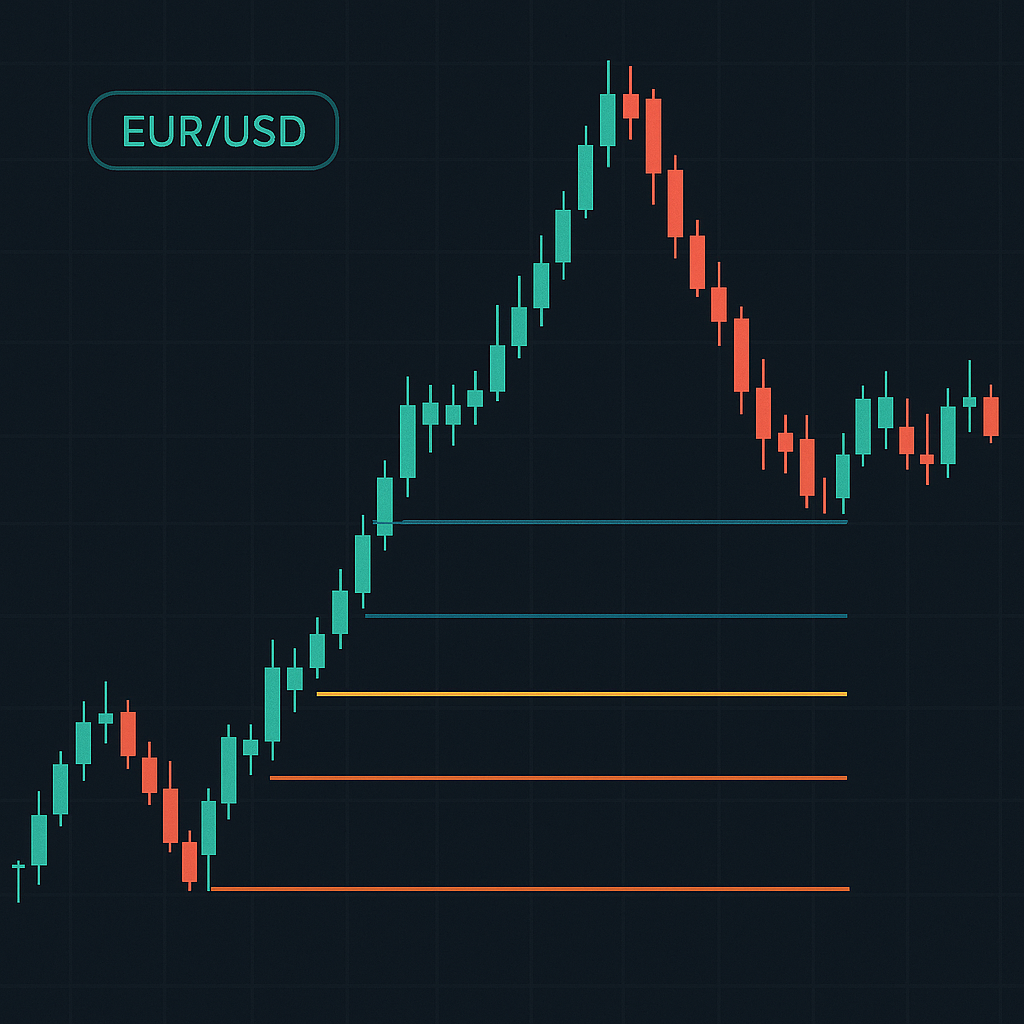
Understanding Fibonacci Retracement Levels
Fibonacci retracement levels are horizontal lines that indicate areas of support or resistance at the key Fibonacci levels before the price continues in the original direction. The most common retracement levels are 23.6%, 38.2%, 50%, 61.8%, and 78.6%.
How to Plot Fibonacci Retracement Levels
Plotting Fibonacci retracement levels involves identifying key swing high and low points on your chart. For instance, if EUR/USD rises from 1.0300 to 1.0500, you would plot the 0% level at 1.0500 and the 100% level at 1.0300. The retracement levels would then indicate potential support levels as the price retraces from the high.
Fibonacci Extensions: Setting Your Profit Targets
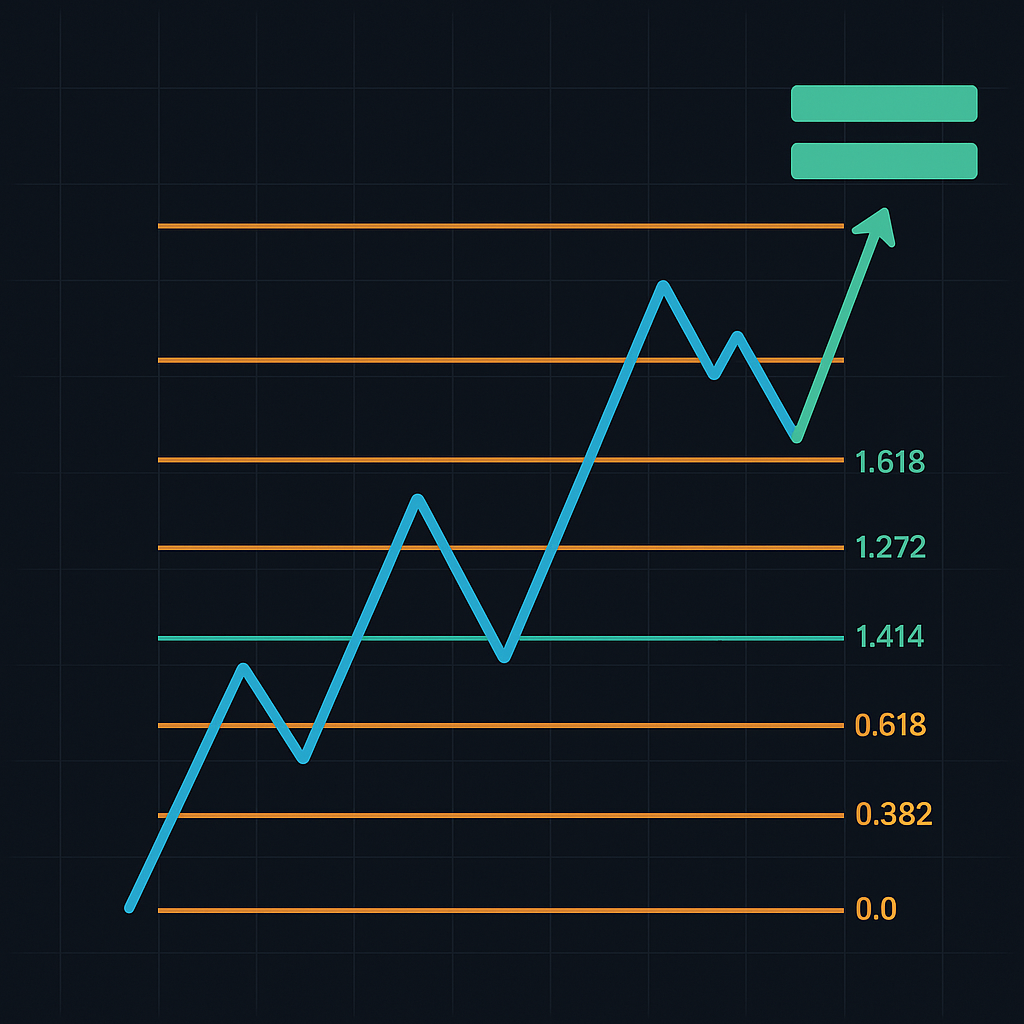
Fibonacci extensions are used to forecast potential price targets when the market is trending. Unlike retracements, extensions go beyond the 100% level to provide levels like 161.8%, 261.8%, and 423.6%.
When to Use Fibonacci Extensions
In a bullish market, where GBP/USD is pushing past 1.2520, traders can use extensions to identify where the market might find resistance after surpassing its previous high. This provides an excellent opportunity for setting take profit levels.
Combining Fibonacci with Other Technical Indicators
For those looking to enhance the accuracy of their trades, combining Fibonacci levels with other technical indicators such as moving averages, RSI, or MACD can be very effective. This confluence technique offers more reliable signals.
Example Strategy: Fibonacci and RSI
Consider a scenario where USD/JPY is trending upward and retracing. You notice a 61.8% retracement level aligning with an RSI reading below 30, suggesting an oversold condition. This confluence increases the likelihood of a reversal.
Using Fibonacci in Different Market Conditions
The effectiveness of Fibonacci levels can vary depending on market conditions. In volatile markets, such as when Gold is trading around $2660.00, traders may find these levels more or less reliable. Understanding the broader market context, including economic data releases and geopolitical events, is crucial.
Step-by-Step: Implementing a Fibonacci Trading Strategy
- Identify a clear trend in the market.
- Use Fibonacci retracement levels to find potential entry points.
- Look for confluence with other indicators for confirmation.
- Set stop loss levels just beyond the next Fibonacci level to minimize risk.
- Use Fibonacci extensions to set realistic profit targets.
- Monitor the trade and adjust as necessary based on market developments.
Common Mistakes When Using Fibonacci Levels
While Fibonacci levels are powerful, they are not infallible. Common mistakes include over-reliance on Fibonacci without other indicators, incorrect plotting of levels, and ignoring larger market trends.
Why Fibonacci Matters: Real Trading Examples
Consider a real-world example: Imagine you are trading EUR/USD, which retraces to the 38.2% level at 1.0440 before resuming its upward trend. Recognizing this retracement allows you to enter the trade with a tighter stop loss, optimizing your risk-reward ratio.
FAQ
- What is the Fibonacci sequence? It's a series of numbers where each number is the sum of the two preceding ones, often appearing in nature and financial markets.
- Are Fibonacci levels reliable? While not foolproof, they are widely used for their effectiveness in identifying potential support and resistance levels.
- Can Fibonacci be used for short-term trading? Yes, Fibonacci levels can be applied to any timeframe, from minutes to months, making them versatile tools for traders.
- How do I plot Fibonacci levels accurately? Use key swing highs and lows to plot Fibonacci levels, ensuring you account for the entire price move.
- Should I use Fibonacci alone? It's best used in conjunction with other indicators to confirm signals and improve trade accuracy.
Risk Disclaimer: Forex trading involves significant risk and is not suitable for every investor. Before deciding to trade foreign exchange, carefully consider your investment objectives, experience level, and risk tolerance. Past performance is not indicative of future results. Always demo trade before investing real capital.


