Master Fibonacci Trading: Your Ultimate Guide to Forex Success
Discover how to master Fibonacci trading in Forex for optimal entries and exits.

Master Fibonacci Trading: Your Ultimate Guide to Forex Success
Imagine having a tool that gives you clear entry and exit points in the forex market. A tool trusted by professional traders worldwide and rooted in the mathematical genius of Leonardo Fibonacci. Welcome to the world of Fibonacci trading in forex, where ratios and sequences guide your trading decisions.
TL;DR: Key Takeaways
- Fibonacci retracement and extension levels are powerful tools for predicting potential support and resistance.
- The key Fibonacci ratios are 23.6%, 38.2%, 50%, 61.8%, and 100%.
- Use Fibonacci levels in conjunction with other indicators for stronger signals.
- Set stop losses 20-50 pips away and target at least 1:2 risk-reward ratio.
- Practice on a demo account before risking real capital.
Understanding Fibonacci in Forex Trading
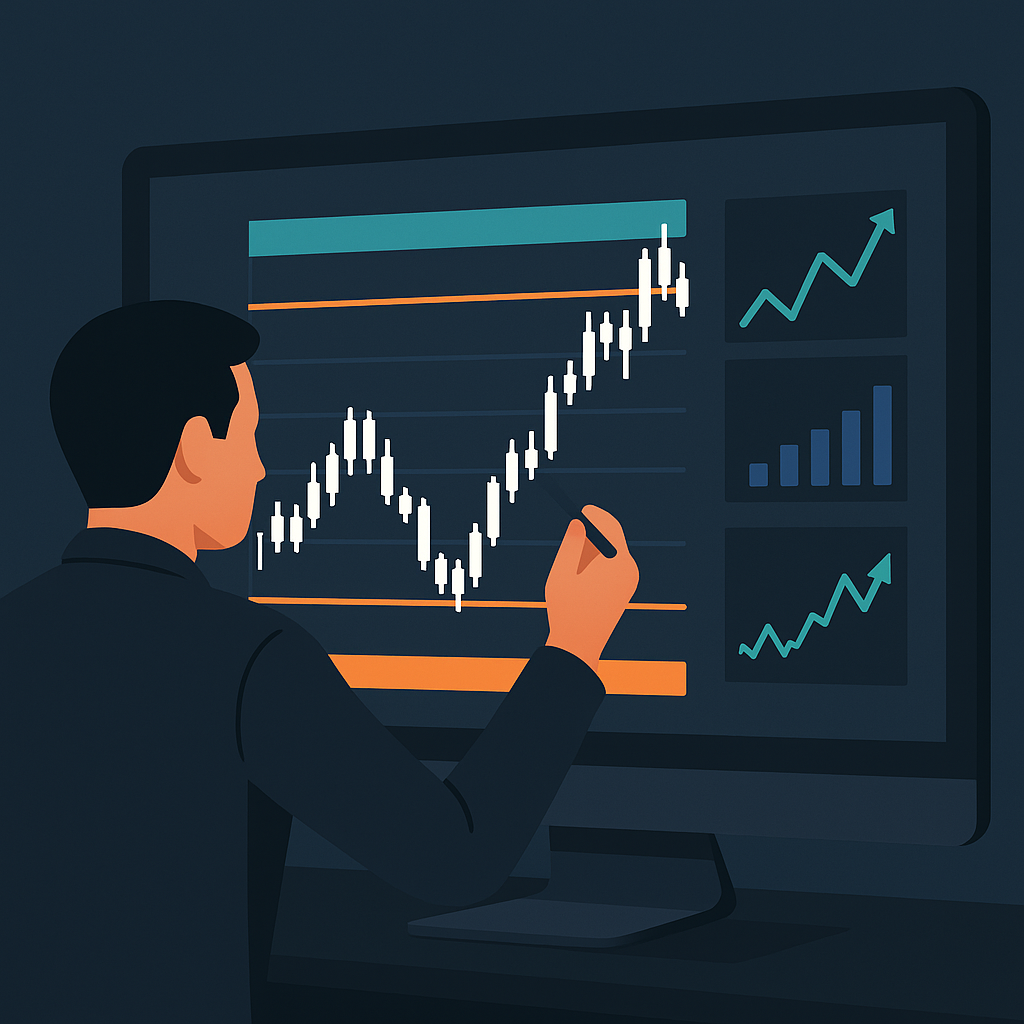
Fibonacci trading uses key Fibonacci ratios derived from the Fibonacci sequence to predict market movements. These ratios are used to identify potential reversal levels in the market, allowing traders to make informed decisions about entries and exits.
The most common Fibonacci levels used in trading are 23.6%, 38.2%, 50%, 61.8%, and 100%. These levels are drawn on charts to indicate potential areas of support and resistance.
How Fibonacci Ratios Work
The Fibonacci sequence starts with 0 and 1, and each subsequent number is the sum of the two preceding numbers. This sequence (0, 1, 1, 2, 3, 5, 8, 13, etc.) creates ratios that are found throughout nature and are used in technical analysis to forecast price movements.
Applying Fibonacci Retracement in Forex
Fibonacci retracement levels are horizontal lines that indicate where support and resistance are likely to occur. They are based on the key Fibonacci levels mentioned above.
To apply Fibonacci retracement, identify a strong price movement from a low to a high (or vice versa), and draw the retracement tool from the start of the move to the end. The retracement levels will then indicate potential reversal zones.
Example: Applying Fibonacci to EUR/USD
Assume EUR/USD has moved from 1.0200 to 1.0420. You would draw the retracement tool from 1.0200 to 1.0420. The 38.2% retracement level might be around 1.0340, indicating a potential support level if the price retraces.
Fibonacci Extensions: Targeting Market Moves
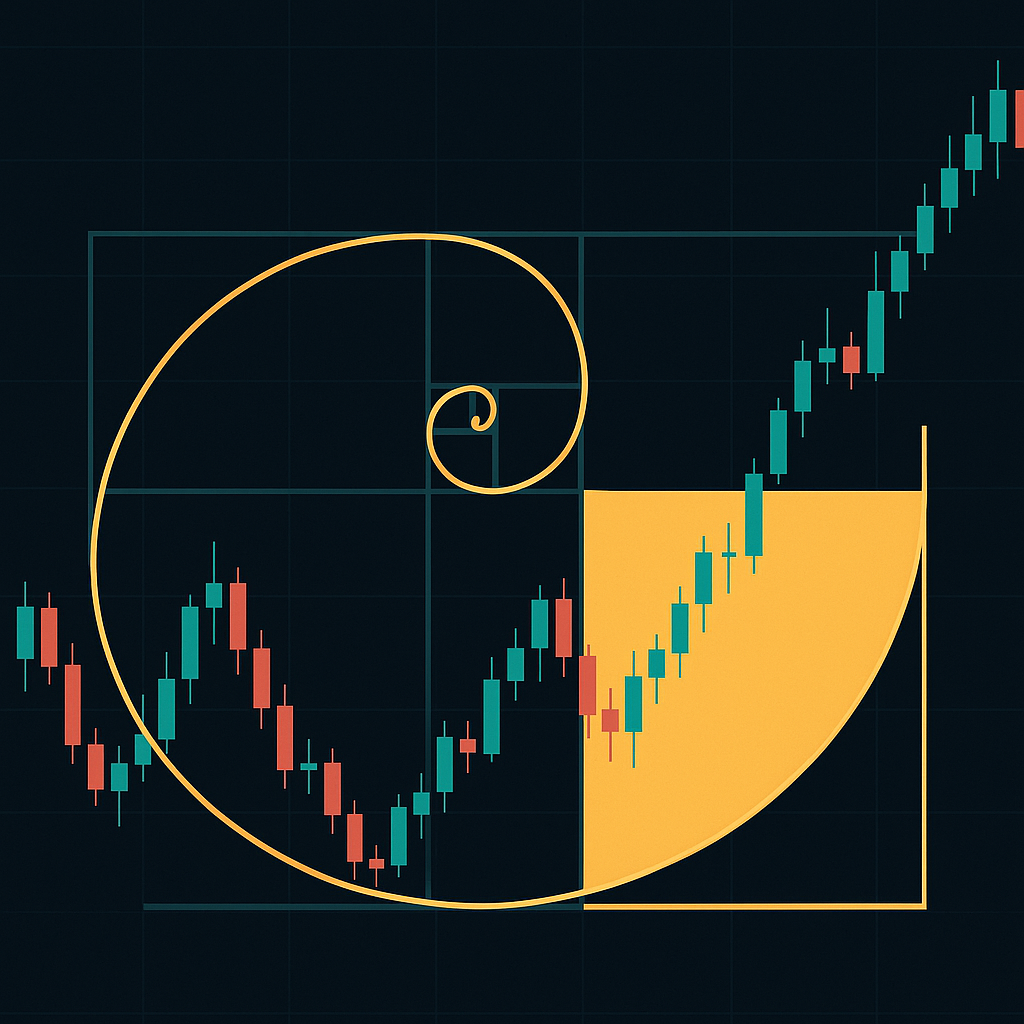
While retracements are used to identify entry points, extensions are used to set profit targets. Fibonacci extensions are levels above or below the initial move, often used to predict how far a price might go after a retracement.
Common extension levels include 161.8%, 261.8%, and 423.6%.
Example: Setting Targets with GBP/USD
If GBP/USD moves from 1.2400 to 1.2520, and retraces to 1.2460, you might set a target at the 161.8% extension, around 1.2580, providing a clear profit-taking level.
Combining Fibonacci with Other Indicators
Fibonacci levels are most effective when used with other technical indicators such as moving averages, MACD, or RSI. This combination can provide confirmation signals and improve the accuracy of your trades.
Example: Using Fibonacci with Moving Averages
If a 50-day moving average aligns with a Fibonacci retracement level, it strengthens that level as a support or resistance area.
Step-by-Step Guide to Using Fibonacci in Your Trading Strategy
- Identify a significant price move.
- Draw Fibonacci retracement from the start to the end of the move.
- Look for confluence with other indicators.
- Set stop-loss and take-profit orders based on Fibonacci extensions.
- Monitor and adjust your trades as needed.
Fibonacci Trading Strategies for Different Market Conditions
Fibonacci trading can be adjusted to suit different market conditions, whether trending or ranging.
Trending Markets
In trending markets, Fibonacci retracement levels can be used to enter trades in the direction of the trend following a pullback.
Ranging Markets
In ranging markets, Fibonacci levels help identify potential reversal points within the range, offering opportunities for shorter-term trades.
Common Mistakes and How to Avoid Them
Many traders misuse Fibonacci by relying solely on these levels without considering other factors. Avoid these common mistakes:
- Not confirming levels with other tools.
- Ignoring market context and fundamentals.
- Setting unrealistic targets without proper analysis.
- Over-leveraging trades based on Fibonacci predictions.
FAQs About Fibonacci Trading
- What is the best timeframe for Fibonacci trading?
While Fibonacci can be applied to any timeframe, it is most effective on daily and 4-hour charts. - Can Fibonacci levels predict future prices?
Fibonacci levels indicate potential areas of interest but should not be solely relied upon for predictions. - Should I use Fibonacci alone?
No, always combine Fibonacci with other indicators and analysis methods. - How do I practice Fibonacci trading?
Use a demo account to practice applying Fibonacci levels before trading with real money.
Risk Disclaimer: Trading forex involves significant risk and may not be suitable for all investors. Ensure you fully understand the risks and seek independent advice if necessary. Past performance is not indicative of future results.