Mastering Support and Resistance in Forex Trading: Your Comprehensive Guide
Master forex support and resistance with our definitive guide. Elevate your trading strategy with key insights.

Mastering Support and Resistance in Forex Trading: Your Comprehensive Guide
Have you ever wondered how some traders consistently find the best entry and exit points in the forex market? It often boils down to one crucial skill: mastering support and resistance levels. These concepts are the bedrock of technical analysis, providing traders with insights into market psychology and potential price movements.
TL;DR: Key Takeaways
- Support and Resistance: Fundamental concepts for identifying price levels where buyers or sellers dominate.
- Price Action: Use candlestick patterns to confirm support and resistance levels.
- Risk Management: Define stop loss and take profit levels based on support/resistance.
- Volatility Considerations: Adjust strategies for high volatility, such as during major news releases.
- Practice with Demo Accounts: Test your strategies without risking real capital.
Understanding Support and Resistance
At its core, support refers to a price level where a currency pair tends to stop falling due to a concentration of buying interest. Conversely, resistance is a price level where selling pressure tends to prevent the price from rising further. These levels are crucial in technical analysis as they help traders make informed decisions about entry, exit, and stop-loss placements.
For example, if EUR/USD is trading at 1.0420 and consistently finds buying interest near 1.0400, 1.0400 becomes a support level. On the flip side, if EUR/USD struggles to break above 1.0500, then 1.0500 is considered a resistance level.
Why Support and Resistance Matter
Support and resistance levels are significant because they represent psychological barriers in the market. Traders often place their buy and sell orders around these levels, which influence the future direction of the price. Understanding these levels allows traders to anticipate potential price movements and make strategic trading decisions.
Identifying Support and Resistance Levels
One of the most effective ways to identify support and resistance is through historical price data. By analyzing past price movements, traders can pinpoint levels where the price has previously reversed or stalled.
Using Trendlines
Trendlines are a popular tool for identifying support and resistance. By connecting a series of higher lows in an uptrend, you can plot a support line. Conversely, connecting lower highs in a downtrend helps identify resistance.
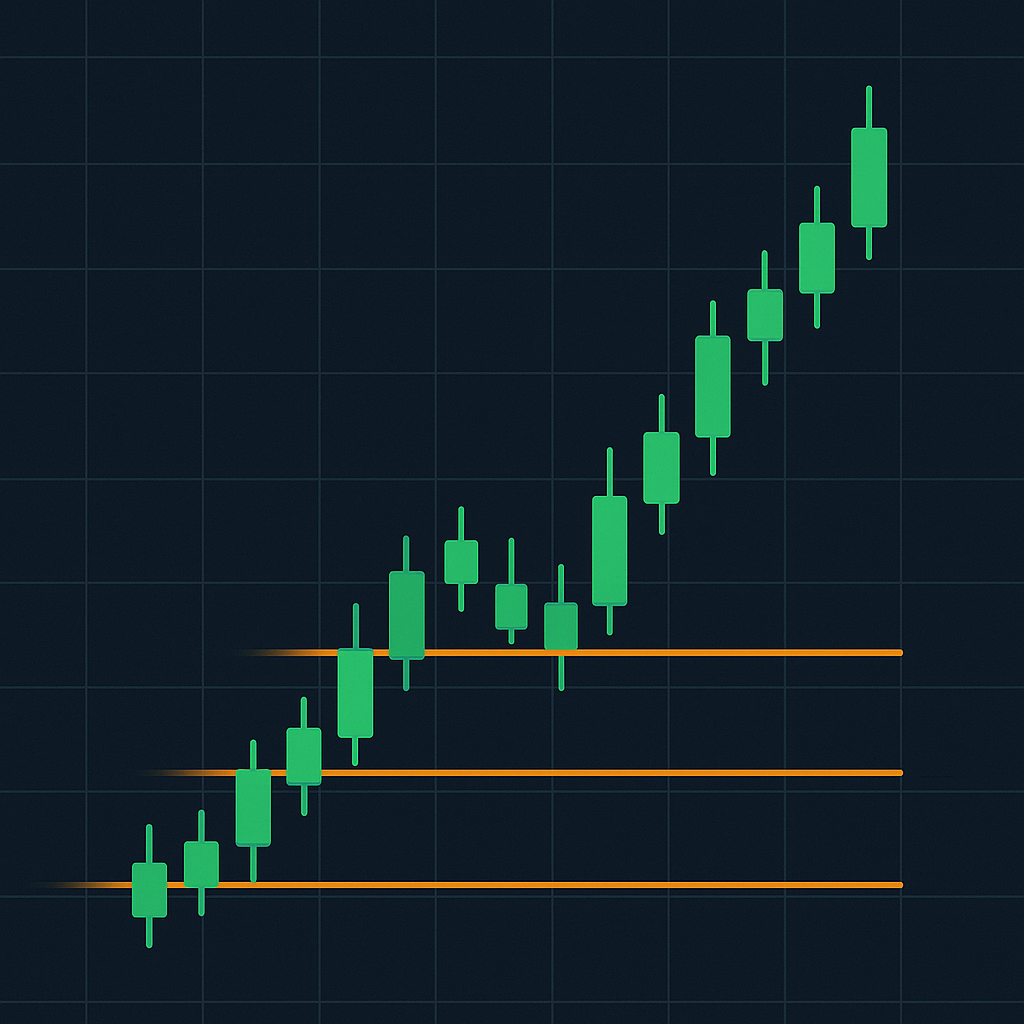
Horizontal Support and Resistance
Horizontal levels are straightforward to identify. They occur when the price bounces off the same price level multiple times, forming a horizontal line of support or resistance.
Types of Support and Resistance
Understanding the different types of support and resistance is crucial for a well-rounded trading strategy. Here are some common types:
- Static Support and Resistance: These levels remain constant over time, such as historical highs and lows.
- Dynamic Support and Resistance: These levels change over time, like moving averages or trendlines.
- Psychological Levels: Round numbers like 1.0000 or 1.1000 often act as psychological barriers.
Trading Strategies Using Support and Resistance
Integrating support and resistance into your trading strategy can significantly enhance your decision-making process. Here are some strategies to consider:
Bounce Trading
Bounce trading involves entering a trade when the price rebounds from a support or resistance level. For instance, if GBP/USD is trading at 1.2520 and approaches a support level at 1.2500, you might consider buying at 1.2510 with a stop loss at 1.2480 and take profit at 1.2560.
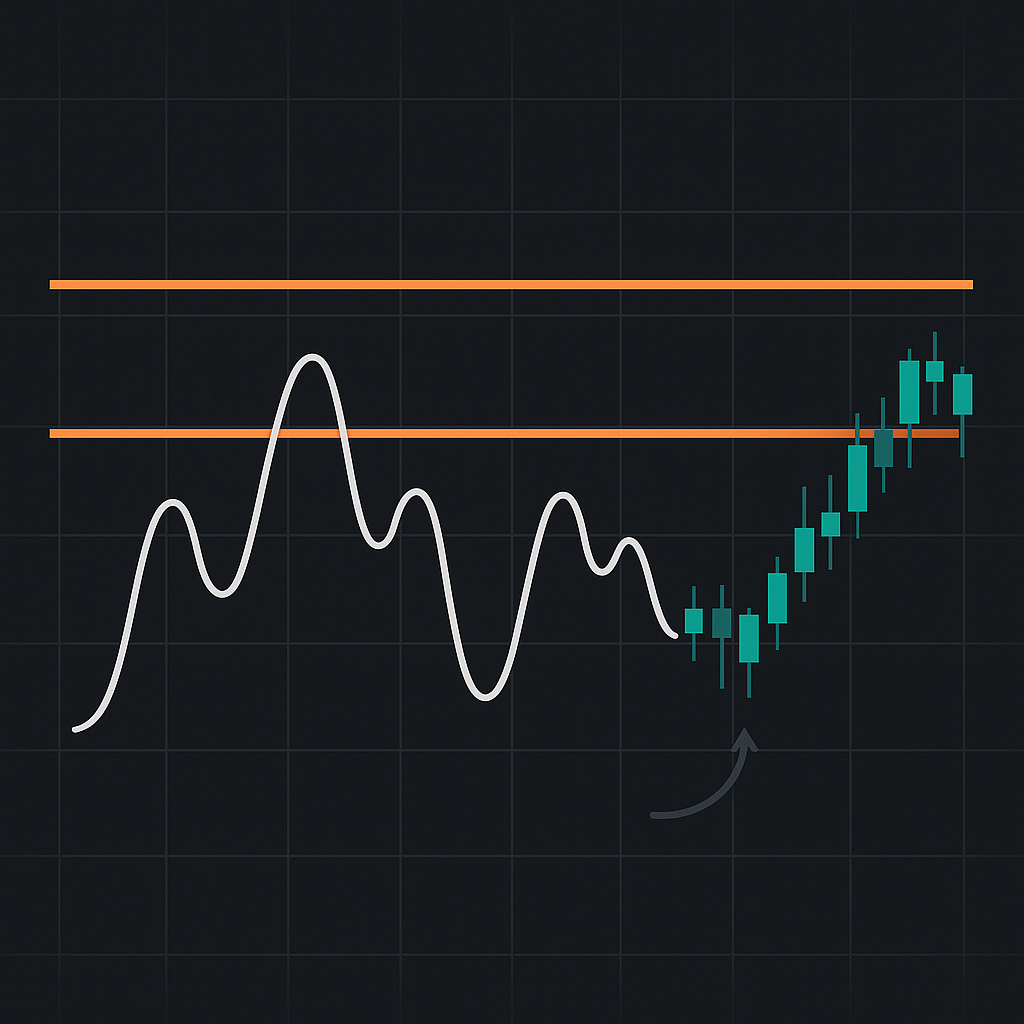
Breakout Trading
Breakout strategies focus on entering trades when the price breaks through a significant support or resistance level. This approach is particularly useful in volatile markets. If USD/JPY breaks through a resistance level at 158.00, traders might enter a buy position aiming for a move to 159.00.
Combining Support and Resistance with Other Indicators
Support and resistance become even more powerful when combined with other technical indicators. Here are some common pairings:
Moving Averages
Moving averages can act as dynamic support and resistance. A 50-day moving average might serve as support in an uptrend, while a 200-day moving average could act as resistance in a downtrend.
Fibonacci Retracements
Fibonacci retracement levels often align with support and resistance levels, providing additional confirmation for trades. For example, a 61.8% retracement level might coincide with a strong support level, strengthening the case for a long position.
Practical Examples and Scenarios
Let’s look at some real-world examples based on current market conditions to illustrate how you can apply support and resistance in your trading:
Scenario 1: EUR/USD Trading
With EUR/USD trading at 1.0420, imagine the pair approaches a historical support level at 1.0400. A trader might decide to place a buy order at 1.0410 with a stop loss at 1.0380 and a take profit at 1.0460, applying a 1:2 risk-reward ratio.
Scenario 2: USD/JPY Volatility
Suppose USD/JPY is trading at 157.50, nearing a major resistance level at 158.00. A trader looking for a breakout might set a buy stop order at 158.10, with a stop loss at 157.70 and a take profit at 159.10.
| Currency Pair | Support Level | Resistance Level | Current Price |
|---|---|---|---|
| EUR/USD | 1.0400 | 1.0500 | 1.0420 |
| GBP/USD | 1.2500 | 1.2600 | 1.2520 |
| USD/JPY | 157.00 | 158.00 | 157.50 |
Common Mistakes and How to Avoid Them
Even experienced traders make mistakes when dealing with support and resistance. Here are some pitfalls to avoid:
Over-relying on One Level
Don’t rely solely on a single support or resistance level. Always look for confirmation through other indicators or price action.
Ignoring the Bigger Picture
Always consider the overall trend and market context. A support level in a strong downtrend might not hold as expected.
FAQs on Support and Resistance
- What is the best way to identify support and resistance levels? Historical price data, combined with trendlines and moving averages, is effective for identifying these levels.
- Can support and resistance levels change over time? Yes, they can evolve based on market dynamics and emerging trends.
- What are psychological levels? These are round numbers like 1.0000 in forex, where traders often place large orders.
- How do support and resistance levels affect trading strategies? They help traders determine entry and exit points and manage risk effectively.
Risk Disclaimer: Trading forex involves significant risk, and it's possible to lose all your invested capital. Always trade with money you can afford to lose, and consider using a demo account to practice. Past performance does not guarantee future results.


