Mastering Fibonacci Trading in Forex: The Ultimate Guide
Unlock the power of Fibonacci trading in forex. Master entries, exits, and targets efficiently.

Mastering Fibonacci Trading in Forex: The Ultimate Guide
Imagine having a tool that helps you pinpoint market reversals with uncanny accuracy. Fibonacci trading offers just that, using mathematical ratios to predict price movements in the forex market. In this comprehensive guide, we'll take you through the essentials of Fibonacci trading, from retracements to extensions, ensuring you master this powerful technique.
TL;DR: Key Takeaways for Fibonacci Trading
- Fibonacci retracement levels are used to identify potential reversal zones.
- Extensions help set realistic price targets for exiting trades.
- Combining Fibonacci with other indicators enhances reliability.
- Adherence to proper risk management is crucial.
- Fibonacci trading is not a guarantee but a probability enhancer.
Understanding Fibonacci in Forex Trading
Fibonacci trading relies on a sequence of numbers identified by Leonardo Fibonacci. The sequence starts with 0 and 1, with each subsequent number being the sum of the two preceding ones. In forex, the most commonly used retracement levels are 23.6%, 38.2%, 50%, 61.8%, and 78.6%. These levels help traders to foresee market corrections within a prevailing trend.
Why Fibonacci Works in Forex
Traders use the Fibonacci sequence because of its natural prevalence in various aspects of life. In forex, human behavior often follows these ratios, creating predictable market movements. For instance, if EUR/USD is trading at 1.0420, a retracement to the 38.2% level could see it pull back to around 1.0370 before resuming its trend.
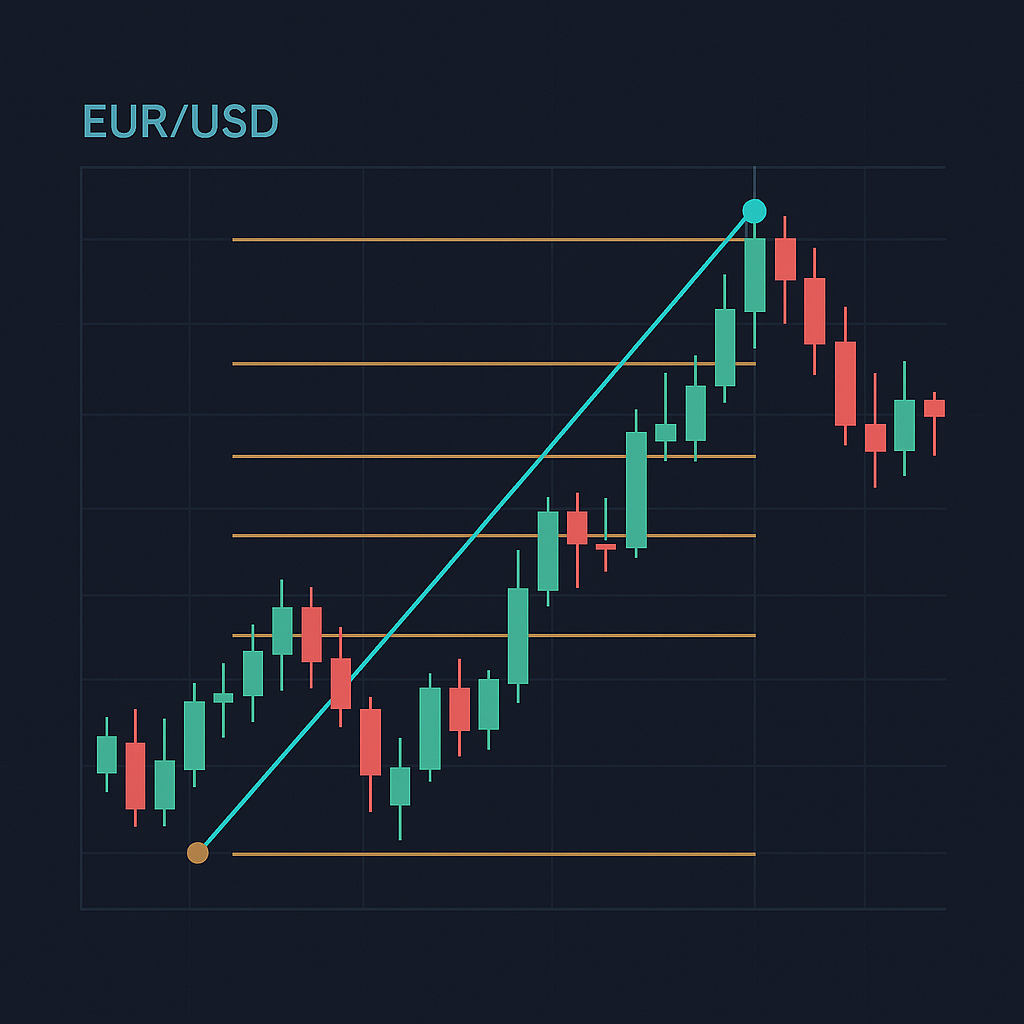
How to Use Fibonacci Retracement Levels
To apply Fibonacci retracement levels effectively, traders often use them in conjunction with other technical analysis tools like moving averages, trend lines, and support/resistance levels. Here’s a step-by-step guide:
- Identify the dominant trend in a currency pair, such as EUR/USD.
- On your charting platform, select the Fibonacci retracement tool.
- Place the tool on the chart, aligning the 0% level with the start of the move and the 100% level with the end.
- Observe the retracement levels and anticipate potential reversal points.
Case Study: Fibonacci Retracements in Action
Consider a scenario where GBP/USD rises from 1.2520 to 1.2670. Applying the Fibonacci retracement tool, we see the 38.2% level at approximately 1.2590 and the 61.8% level near 1.2560. These levels can serve as potential entry points for traders looking to buy the pair on a pullback.
| Retracement Level | Price Level |
|---|---|
| 38.2% | 1.2590 |
| 50% | 1.2595 |
| 61.8% | 1.2560 |
Fibonacci Extensions: Setting Profit Targets
While retracement levels help find entry points, Fibonacci extensions are vital for setting profit targets. They project price movements beyond the current trend, using levels such as 127.2%, 161.8%, and 261.8%. For example, if USD/JPY breaks above 157.50, traders might target the 161.8% extension, forecasting a move towards 159.00.
Combining Fibonacci with Other Indicators
To enhance the accuracy of Fibonacci trading, it’s effective to combine it with other indicators such as the Relative Strength Index (RSI) or moving averages. This synergy can confirm entry and exit points, minimizing false signals. For instance, if the RSI supports a reversal at a Fibonacci level, the trade's reliability increases.
Fibonacci Trading Strategies for Different Market Conditions
Market conditions play a critical role in the success of Fibonacci trading strategies. In trending markets, retracements help identify continuation patterns, while in ranging markets, extensions can forecast breakouts. Traders should adjust their strategies according to the prevailing market environment.
Real-world Example: Trading Gold with Fibonacci
Gold (XAUUSD) is a popular asset for Fibonacci trading due to its volatility. Suppose gold prices fall from $2680 to $2660. A Fibonacci retracement could pinpoint a potential reversal at around $2665 (38.2% level), offering a lucrative buying opportunity.
Common Mistakes in Fibonacci Trading
Even experienced traders can err when using Fibonacci tools. Common mistakes include over-reliance on Fibonacci without confirming signals, misplacing retracement levels, and ignoring broader market trends. Avoid these pitfalls by integrating comprehensive analysis techniques.
FAQs about Fibonacci Trading in Forex
- What is a Fibonacci retracement? It's a technical analysis tool used to identify potential reversal levels during a price movement.
- How accurate is Fibonacci in forex trading? While not infallible, it enhances the probability of successful trades when combined with other indicators.
- Can Fibonacci be used in all market conditions? Yes, but its effectiveness improves when aligned with the market's trend or range status.
- Is Fibonacci trading suitable for beginners? Absolutely, but beginners should practice on a demo account to hone their skills.
Risk Disclaimer: Forex trading involves significant risk and may not be suitable for all investors. Past performance is not indicative of future results. We recommend demo trading for beginners to understand the risks involved.


